Why you should use Application Services with your Oracle Database
On a Single-Instance Oracle Database, Application Services offer benefits for Performance Monitoring & Tracing. That’s the focus of this posting. If you are on RAC respectively Data Guard already, you will use Services at least to provide Connect-Time Failover. You may find some additional useful things to do with them here. The playing field:
SQL> select * from v$version;

BANNER
--------------------------------------------------------------------------------
Oracle Database 11g Enterprise Edition Release 11.2.0.3.0 - 64bit Production
PL/SQL Release 11.2.0.3.0 - Production
CORE    11.2.0.3.0    Production
TNS for Linux: Version 11.2.0.3.0 - Production
NLSRTL Version 11.2.0.3.0 - Production
My demo DB has no Application Services yet. In the most simple case, there is one Application running and we take backups, so that gives us two services to introduce:
SQL> exec dbms_service.create_service('app1','app1')

PL/SQL procedure successfully completed.

SQL> exec dbms_service.create_service('bk','bk')

PL/SQL procedure successfully completed.
With Grid Infrastructure installed, we would use srvctl add service instead. The services are not yet started. Subsequently, an after startup on database trigger should do that.
SQL> exec dbms_service.start_service('app1')

PL/SQL procedure successfully completed.

SQL> exec dbms_service.start_service('bk')

PL/SQL procedure successfully completed.

SQL> grant dba to adam identified by adam;

Grant succeeded.

SQL> exec dbms_workload_repository.create_snapshot

PL/SQL procedure successfully completed.

SQL> select snap_id,to_char(begin_interval_time,'yyyy-mm-dd:hh24:mi:ss')
from dba_hist_snapshot order by 1;

   SNAP_ID TO_CHAR(BEGIN_INTER
---------- -------------------
     2 2012-01-18:15:09:15
     3 2012-01-18:15:20:30
     4 2012-01-19:12:51:40
     5 2012-03-19:12:03:03
     6 2012-10-31:14:59:25
The following uses Easy Connect (my host is named uhesse1; my Listener Port is 1521) to attach to the services:
SQL> connect adam/adam@uhesse1/app1
Connected.
SQL> alter session set workarea_size_policy=manual;

Session altered.

SQL> alter session set sort_area_size=100000000;

Session altered.

SQL> create table sales as select
rownum as id,
mod(rownum,5) as channel_id,
mod(rownum,1000) as cust_id,
5000 as amount_sold,
sysdate as time_id
from dual connect by level<=1e6;

Table created.

SQL> update sales set amount_sold=amount_sold*1;

1000000 rows updated.

SQL> commit;

Commit complete.

SQL> exit
Disconnected from Oracle Database 11g Enterprise Edition Release 11.2.0.3.0 - 64bit Production
With the Partitioning, OLAP and Data Mining options
[oracle@uhesse1 ~]$ rman target sys/oracle@uhesse1/bk

Recovery Manager: Release 11.2.0.3.0 - Production on Wed Oct 31 15:13:04 2012

Copyright (c) 1982, 2011, Oracle and/or its affiliates.  All rights reserved.

connected to target database: PRIMA (DBID=2003897072)

RMAN> backup database;

Starting backup at 31-OCT-12
using target database control file instead of recovery catalog
allocated channel: ORA_DISK_1
channel ORA_DISK_1: SID=50 device type=DISK
channel ORA_DISK_1: starting full datafile backup set
channel ORA_DISK_1: specifying datafile(s) in backup set
input datafile file number=00001 name=/home/oracle/prima/system01.dbf
input datafile file number=00002 name=/home/oracle/prima/sysaux01.dbf
input datafile file number=00003 name=/home/oracle/prima/undotbs01.dbf
input datafile file number=00004 name=/home/oracle/prima/users01.dbf
channel ORA_DISK_1: starting piece 1 at 31-OCT-12
channel ORA_DISK_1: finished piece 1 at 31-OCT-12
piece handle=/home/oracle/flashback/PRIMA/backupset/2012_10_31/o1_mf_nnndf_TAG20121031T151314_892dhwso_.bkp tag=TAG20121031T151314 comment=NONE
channel ORA_DISK_1: backup set complete, elapsed time: 00:00:15
channel ORA_DISK_1: starting full datafile backup set
channel ORA_DISK_1: specifying datafile(s) in backup set
including current control file in backup set
including current SPFILE in backup set
channel ORA_DISK_1: starting piece 1 at 31-OCT-12
channel ORA_DISK_1: finished piece 1 at 31-OCT-12
piece handle=/home/oracle/flashback/PRIMA/backupset/2012_10_31/o1_mf_ncsnf_TAG20121031T151314_892djcbb_.bkp tag=TAG20121031T151314 comment=NONE
channel ORA_DISK_1: backup set complete, elapsed time: 00:00:01
Finished backup at 31-OCT-12

RMAN> exit

Recovery Manager complete.
[oracle@uhesse1 ~]$ sqlplus / as sysdba

SQL*Plus: Release 11.2.0.3.0 Production on Wed Oct 31 15:13:41 2012

Copyright (c) 1982, 2011, Oracle.  All rights reserved.

Connected to:
Oracle Database 11g Enterprise Edition Release 11.2.0.3.0 - 64bit Production
With the Partitioning, OLAP and Data Mining options

SQL> exec dbms_workload_repository.create_snapshot

PL/SQL procedure successfully completed.

SQL> select snap_id,to_char(begin_interval_time,'yyyy-mm-dd:hh24:mi:ss')
from dba_hist_snapshot order by 1;

   SNAP_ID TO_CHAR(BEGIN_INTER
---------- -------------------
     2 2012-01-18:15:09:15
     3 2012-01-18:15:20:30
     4 2012-01-19:12:51:40
     5 2012-03-19:12:03:03
     6 2012-10-31:14:59:25
     7 2012-10-31:15:06:13

6 rows selected.
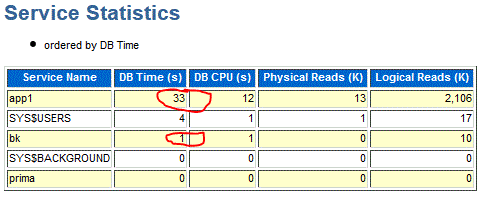
Some „Application“ load was followed by an RMAN backup. We can now differentiate those loads. The AWR report for the last two snapshots show this section:
We can tell from the low values of DB Time for the bk service in relation to the app1 service that the (Online-)Backup has had almost no impact on performance for end users here. Also, we have v$-views for services:
SQL> set lines 200
set pages 300
col service_name for a10
select service_name,event,time_waited
from v$service_event natural join v$event_name
where service_name in ('app1','bk')
and wait_class<>'Idle'
order by 1,3;

SERVICE_NA EVENT                                                            TIME_WAITED
---------- ---------------------------------------------------------------- -----------
app1       control file sequential read                                               0
app1       SQL*Net message to client                                                  0
app1       db file single write                                                       1
app1       db file scattered read                                                     1
app1       log file sync                                                              1
app1       control file parallel write                                                1
app1       direct path write                                                          2
app1       direct path sync                                                           3
app1       Data file init write                                                       3
app1       Disk file operations I/O                                                   4
app1       buffer busy waits                                                          5
app1       free buffer waits                                                         13
app1       log file switch (private strand flush incomplete)                         14
app1       db file sequential read                                                   26
app1       log file switch completion                                                28
app1       log buffer space                                                        1635
bk       Parameter File I/O                                                           0
bk       db file scattered read                                                       0
bk       SQL*Net message to client                                                    0
bk       SQL*Net break/reset to client                                                0
bk       db file single write                                                         0
bk       db file sequential read                                                      2
bk       control file parallel write                                                  7
bk       control file single write                                                    8
bk       Disk file operations I/O                                                    12
bk       control file sequential read                                                18
bk       events in waitclass Other                                                  217
bk       RMAN backup & recovery I/O                                                 757

28 rows selected.

SQL> select service_name,value
from v$service_stats
where service_name in ('app1','bk')
and stat_name='physical reads';

SERVICE_NA    VALUE
---------- ----------
app1            13422
bk                351
There are completely different Top Wait-Events for the two services. ‚physical reads‘ was just one example from the hundreds of available stats. In the very same manner, multiple applications running on the same DB could be differentiated. Furthermore, we can switch on tracing now for only certain services resp. applications:
SQL> exec dbms_monitor.serv_mod_act_trace_enable('app1')

PL/SQL procedure successfully completed.

SQL> connect adam/adam@uhesse1/app1
Connected.
SQL> select count(*) from sales;

  COUNT(*)
----------
   1000000

SQL> select distinct channel_id from sales;

CHANNEL_ID
----------
     1
     2
     4
     3
     0

SQL> connect / as sysdba
Connected.
SQL> exec dbms_monitor.serv_mod_act_trace_disable('app1')

PL/SQL procedure successfully completed.
This kind of service tracing produces potentially many trace files that we can consolidate (and identify) with trcsess like this:
[oracle@uhesse1 trace]$ trcsess output=app1.trc service=app1 *.trc
Afterwards, we can get a better readable output of the trace file with tkprof as usual, showing all the statements of the applications together with their execution plans.
Conclusion: You will always implement Application Services with RAC respectively Data Guard. For Single-Instance, you should use them also because
1) You may use RAC resp. Data Guard in the future and then you have everything in place already
2) You can do Performance Monitoring with a finer granule (on the Application layer) with them
3) You can trace with a finer granule as well
Exadata X3 Key Points
This post will give a brief summary of the Exadata Database Machine X3 as it was announced at the Oracle Open World by Larry Ellision:
 (URL above is the complete Keynote; X3 announcement comes at 31:29)
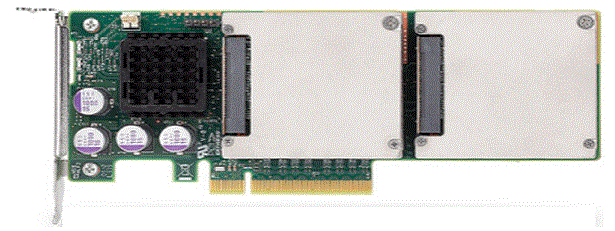
The X3 Storage Servers have 4 times the Flash Capacity than X2: Each cell comes with 1600 GB, using Oracle’s Sun Flash Accelerator F40 PCIe Card now
 The X3 Database Servers have now 2 x Eight-Core Intel® Xeon® E5-2690(SandyBridge) Processors instead of 2 x Six-Cores in X2
They have 128 GB memory each, instead of 96 GB on X2
The price of an X3 Rack remains the same except for the Software Licenses that are computed by the number of cores.
The X3 Entry Level Rack is now 1/8 Rack. It has got the same hardware as a 1/4 rack, but half of the cores, memory and storage capacity disabled.
Not only on X3, the Flash Cache will now work as a Write Back Cache. Older versions will be enabled to use Write Back Flash Cache with a Software Update.
More details:
Auditing ALTER SYSTEM commands
A recent OTN Thread inspired this posting: How can we track down initialization parameter changes that someone has done with ALTER SYSTEM? One way would be to monitor the alert.log, but I think auditing should be most appropriate here. Preparing the playing field:
SQL> select * from v$version;

BANNER
--------------------------------------------------------------------------------
Oracle Database 11g Enterprise Edition Release 11.2.0.3.0 - 64bit Production
PL/SQL Release 11.2.0.3.0 - Production
CORE    11.2.0.3.0    Production
TNS for Linux: Version 11.2.0.3.0 - Production
NLSRTL Version 11.2.0.3.0 - Production

SQL> show parameter audit_trail

NAME                     TYPE     VALUE
------------------------------------ ----------- ------------------------------
audit_trail                 string     NONE
When you use DBCA to create an 11g Database, AUDIT_TRAIL will show as DB – I did the creation on the command line, therefore it is still NONE. When we want to see the particular ALTER SYSTEM command like in the demonstration, the value EXTENDED is additionally required.
SQL> alter system set audit_trail='DB','EXTENDED' scope=spfile;

System altered.

SQL> shutdown immediate

ORACLE instance shut down.

SQL> startup
ORACLE instance started.

Total System Global Area  313159680 bytes
Fixed Size            2227944 bytes
Variable Size          255852824 bytes
Database Buffers       50331648 bytes
Redo Buffers            4747264 bytes
Database mounted.
Database opened.
SQL> audit alter system by access;

Audit succeeded.

SQL> alter system set processes=250 scope=spfile;

System altered.

SQL> alter system set parallel_degree_policy=limited;

System altered.

SQL> alter system set result_cache_mode=force scope=memory;

System altered.
You may notice that I was still SYS when doing the ALTER SYSTEM commands. That is important here, because they are not audited, as we can see below. If you want auditing for SYS, this posting shows how to do that.
SQL> grant dba to adam identified by adam;

Grant succeeded.

SQL> connect adam/adam
Connected.

SQL> alter system set processes=200 scope=spfile;

System altered.

SQL> alter system set parallel_degree_policy=manual;

System altered.

SQL> alter system set result_cache_mode=manual scope=memory;

System altered.

SQL> select username,sql_text from dba_audit_trail where sql_text like 'alter system%';

USERNAME   SQL_TEXT
---------- ----------------------------------------------------------------------
ADAM       alter system set processes=200 scope=spfile
ADAM       alter system set parallel_degree_policy=manual
ADAM       alter system set result_cache_mode=manual scope=memory
Conclusion: ALTER SYSTEM commands can be audited very comfortable into the audit trail as long as you don’t do them as SYS. All actions of SYS can be audited also with a different approach. As always: Don’t believe it, test it 🙂


