Beiträge getaggt mit OU EMEA Newsletter
Active Data Guard – what does it mean?
There are misconceptions and half-truths about that term that I see time after time again in forums, postings and comments.
Some people think that Active Data Guard is a fancy marketing term for Standby Databases in Oracle. Wrong, that is just plain Data Guard 🙂
Most people think that Active Data Guard means that a Physical Standby Database can be used for queries while it is still applying redo. Not the whole truth, because that is just one feature – Real-Time Query – which is included in the Active Data Guard option.
Active Data Guard is an option, coming with an extra charge. Active is supposed to indicate that you can use the standby database for production usage – it is not just waiting for the primary database to fail.
In 11g, Active Data Guard includes three features:
- Real-Time Query
- Automatic Block Media Recovery
- Block Change Tracking on the physical standby
In 12c, Active Data Guard got even more enhanced and includes now the features:
- Real-time Query
- Automatic Block Media Recovery
- Block Change Tracking on the physical standby
- Far Sync
- Real-Time Cascade
- Global Data Services
- Application Continuity
- Rolling Upgrade using DBMS_ROLLING
The bad news is that many of the 12c Data Guard New Features require Active Data Guard
Evidence for successful #Oracle Performance Tuning
This article shows an easy way to determine, whether your Oracle Database Performance Tuning task has been successful – or not. In the end, it boils down to „The objective for tuning an Oracle system could be stated as reducing the time that users spend in performing some action on the database, or simply reducing DB time.“ as the Online Documentation says. Best proof would be a confirmation from the end users that run time got reduced; second best is a proof of reduced DB time, which is discussed here.
A tuning task should always end with such a proof; your gut feeling or high confidence is not sufficient – or as I like to say: „Don’t believe it, test it!“ 🙂
The demo scenario: With an Oracle Enterprise Edition version 11.2.0.3, an application uses these commands to delete rows:
SQL> create table t as select * from dual where 1=2;

Table created.
SQL> begin
 for i in 1..100000 loop
 execute immediate 'delete from t where dummy='||to_char(i);
 end loop;
 end;
 /
I am pretty sure that this code is not optimal, because it uses Literals instead of Bind Variables where it is not appropriate. Before I implement an improved version of the code, I take a Baseline with Automatic Workload Repository (AWR) snapshots. On my demo system, snapshots are taken every ten minutes:
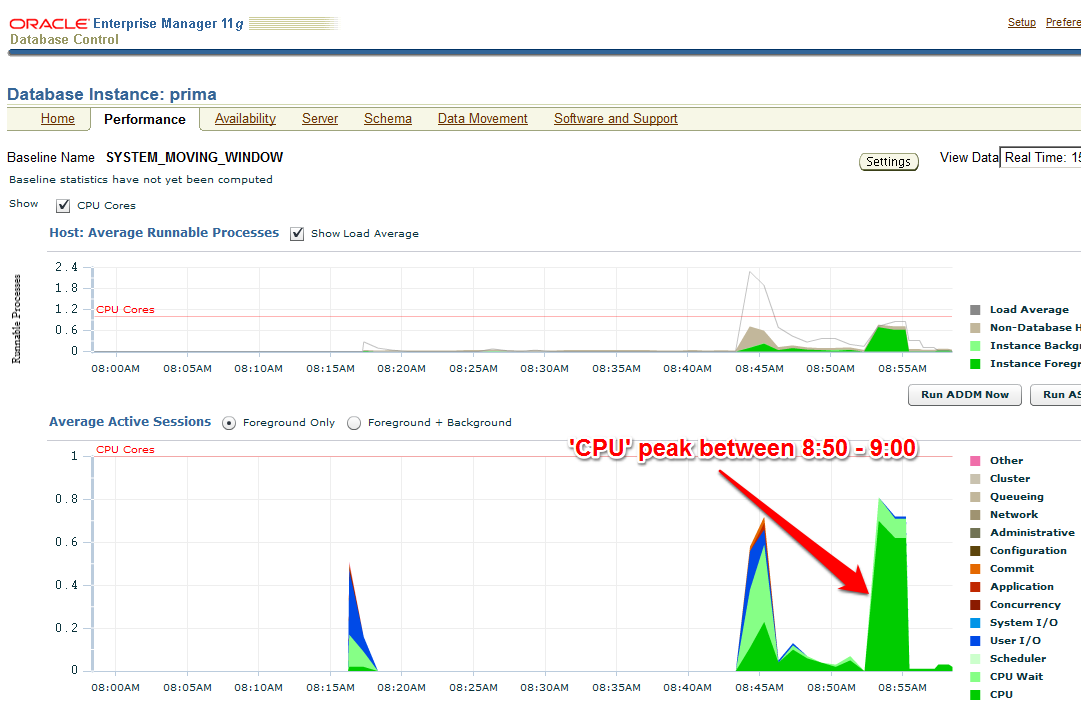
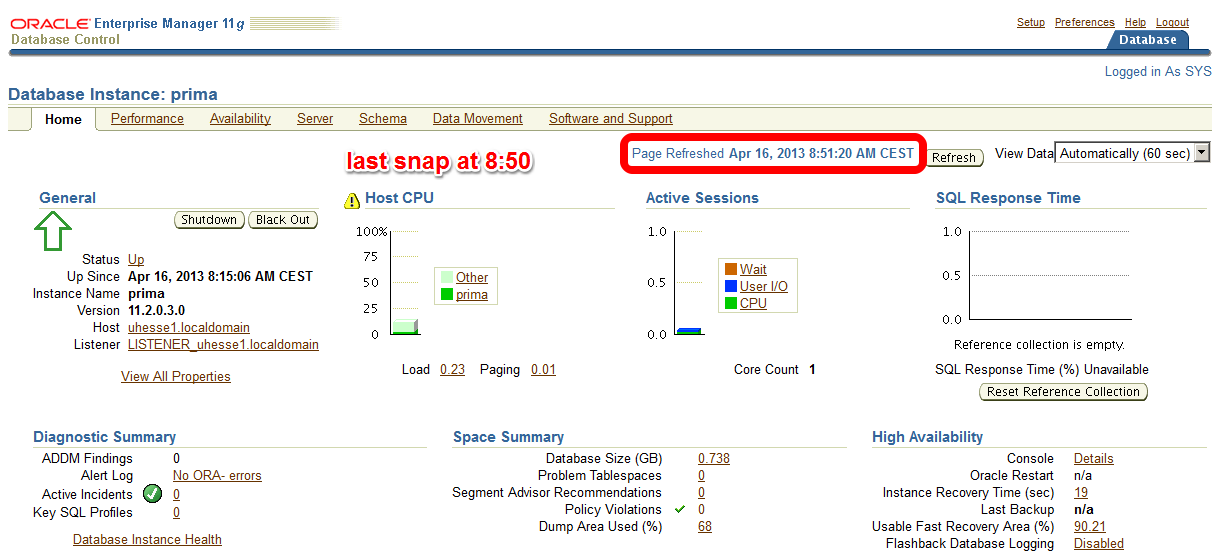 The code with Literals was just called – now about 10 minutes later on the Enterprise Manager (EM) Performance page:
 The AWR report that I take (with EM or with awrrpt.sql) as the baseline shows the following:
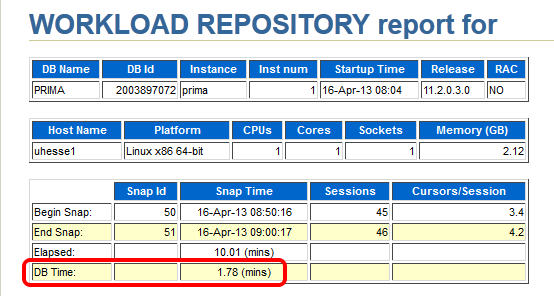 Notice especially the poor Library Cache hit ration, significant for not using Bind Variables – and the meaningless high Buffer Cache hit ration 🙂
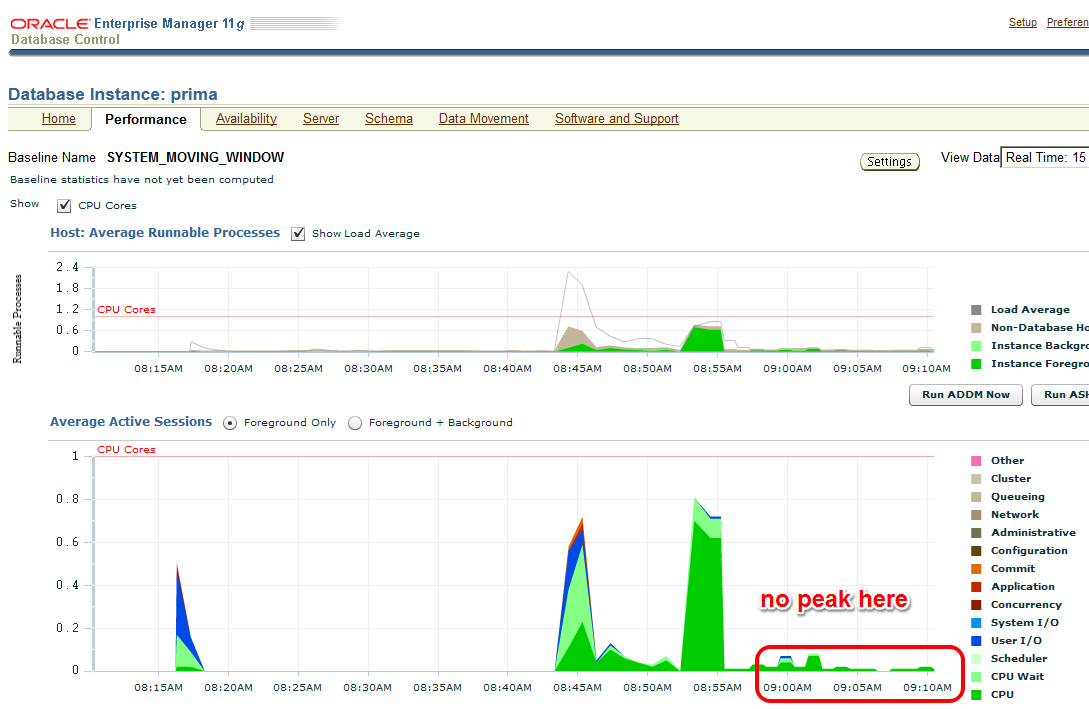
 Starting after 9:00 am, my improved code that uses Bind Variables runs:
SQL> begin
 for i in 1..100000 loop
 delete from t where dummy=to_char(i);
 end loop;
 end;
 /
The EM Performance page show no peak during the next 10 minutes which represent my comparison period after the tuning task:
 Let’s look at the AWR report of the second snapshot range after the tuning task:
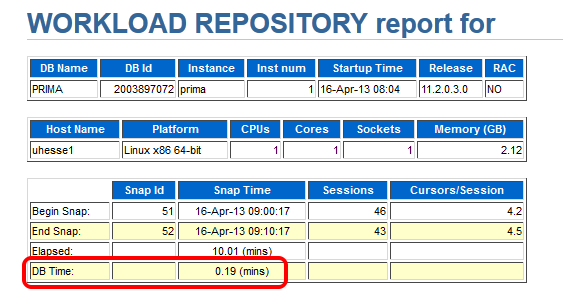 Same wall clock time, same application load, but reduced DB time – I was successful! Could stop here, but some more details:
 The important (especially for OLTP systems) Library Cache hit ratio is now very good. A very convenient way to compare the two snapshot ranges is the ‚AWR Compare Periods‘ feature in EM (or awrddrpt.sql) , which shows us instructively:
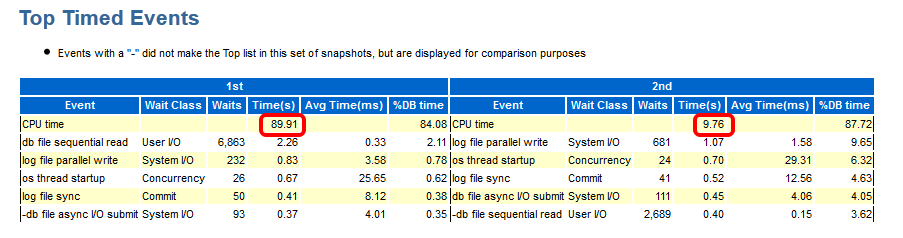
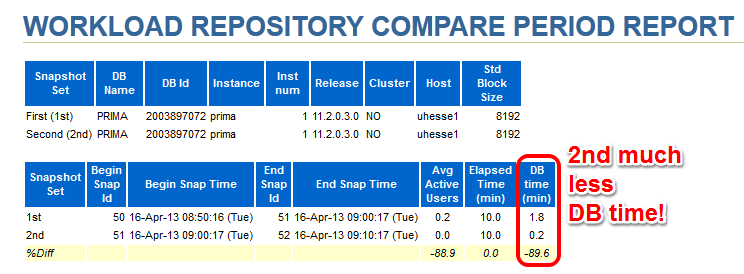 Although in both periods, CPU was the top event (also in % DB time), it took much less time in total for the 2nd period:
 The Time Model Statistics confirm a strongly reduced Parse Time for the 2nd period:
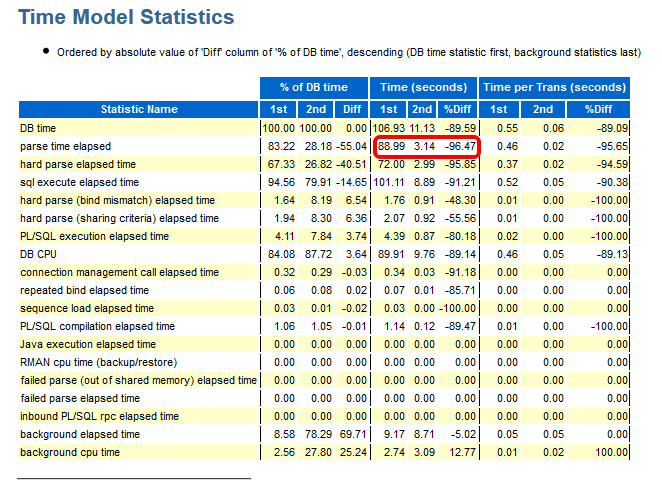 Especially, we see a striking improvement for the run time of the code with Bind Variables: From about 82 seconds down to about 3 seconds!
 This kind of proof (less DB time) can be used also in cases where the reduction of run time for a single statement is not so obvious as in my example. If 1000 users had done each 100 deletes, they would have seen not much difference in run time each – but the parse time summarizes and impacts overall performance similar as seen here. If you would like to see the three original AWR reports were I took the screen shots above from, they are here as PDFs
Conclusion: You will – and should – be able to prove the effectiveness of your Oracle Database Tuning task with a reduction of DB time from an AWR report comparison. After all, you don’t want to waste your efforts, do you? 🙂
Addendum: This posting was published in the Oracle University EMEA Newsletter May 2013
Why you should use Application Services with your Oracle Database
On a Single-Instance Oracle Database, Application Services offer benefits for Performance Monitoring & Tracing. That’s the focus of this posting. If you are on RAC respectively Data Guard already, you will use Services at least to provide Connect-Time Failover. You may find some additional useful things to do with them here. The playing field:
SQL> select * from v$version;

BANNER
--------------------------------------------------------------------------------
Oracle Database 11g Enterprise Edition Release 11.2.0.3.0 - 64bit Production
PL/SQL Release 11.2.0.3.0 - Production
CORE    11.2.0.3.0    Production
TNS for Linux: Version 11.2.0.3.0 - Production
NLSRTL Version 11.2.0.3.0 - Production
My demo DB has no Application Services yet. In the most simple case, there is one Application running and we take backups, so that gives us two services to introduce:
SQL> exec dbms_service.create_service('app1','app1')

PL/SQL procedure successfully completed.

SQL> exec dbms_service.create_service('bk','bk')

PL/SQL procedure successfully completed.
With Grid Infrastructure installed, we would use srvctl add service instead. The services are not yet started. Subsequently, an after startup on database trigger should do that.
SQL> exec dbms_service.start_service('app1')

PL/SQL procedure successfully completed.

SQL> exec dbms_service.start_service('bk')

PL/SQL procedure successfully completed.

SQL> grant dba to adam identified by adam;

Grant succeeded.

SQL> exec dbms_workload_repository.create_snapshot

PL/SQL procedure successfully completed.

SQL> select snap_id,to_char(begin_interval_time,'yyyy-mm-dd:hh24:mi:ss')
from dba_hist_snapshot order by 1;

   SNAP_ID TO_CHAR(BEGIN_INTER
---------- -------------------
     2 2012-01-18:15:09:15
     3 2012-01-18:15:20:30
     4 2012-01-19:12:51:40
     5 2012-03-19:12:03:03
     6 2012-10-31:14:59:25
The following uses Easy Connect (my host is named uhesse1; my Listener Port is 1521) to attach to the services:
SQL> connect adam/adam@uhesse1/app1
Connected.
SQL> alter session set workarea_size_policy=manual;

Session altered.

SQL> alter session set sort_area_size=100000000;

Session altered.

SQL> create table sales as select
rownum as id,
mod(rownum,5) as channel_id,
mod(rownum,1000) as cust_id,
5000 as amount_sold,
sysdate as time_id
from dual connect by level<=1e6;

Table created.

SQL> update sales set amount_sold=amount_sold*1;

1000000 rows updated.

SQL> commit;

Commit complete.

SQL> exit
Disconnected from Oracle Database 11g Enterprise Edition Release 11.2.0.3.0 - 64bit Production
With the Partitioning, OLAP and Data Mining options
[oracle@uhesse1 ~]$ rman target sys/oracle@uhesse1/bk

Recovery Manager: Release 11.2.0.3.0 - Production on Wed Oct 31 15:13:04 2012

Copyright (c) 1982, 2011, Oracle and/or its affiliates.  All rights reserved.

connected to target database: PRIMA (DBID=2003897072)

RMAN> backup database;

Starting backup at 31-OCT-12
using target database control file instead of recovery catalog
allocated channel: ORA_DISK_1
channel ORA_DISK_1: SID=50 device type=DISK
channel ORA_DISK_1: starting full datafile backup set
channel ORA_DISK_1: specifying datafile(s) in backup set
input datafile file number=00001 name=/home/oracle/prima/system01.dbf
input datafile file number=00002 name=/home/oracle/prima/sysaux01.dbf
input datafile file number=00003 name=/home/oracle/prima/undotbs01.dbf
input datafile file number=00004 name=/home/oracle/prima/users01.dbf
channel ORA_DISK_1: starting piece 1 at 31-OCT-12
channel ORA_DISK_1: finished piece 1 at 31-OCT-12
piece handle=/home/oracle/flashback/PRIMA/backupset/2012_10_31/o1_mf_nnndf_TAG20121031T151314_892dhwso_.bkp tag=TAG20121031T151314 comment=NONE
channel ORA_DISK_1: backup set complete, elapsed time: 00:00:15
channel ORA_DISK_1: starting full datafile backup set
channel ORA_DISK_1: specifying datafile(s) in backup set
including current control file in backup set
including current SPFILE in backup set
channel ORA_DISK_1: starting piece 1 at 31-OCT-12
channel ORA_DISK_1: finished piece 1 at 31-OCT-12
piece handle=/home/oracle/flashback/PRIMA/backupset/2012_10_31/o1_mf_ncsnf_TAG20121031T151314_892djcbb_.bkp tag=TAG20121031T151314 comment=NONE
channel ORA_DISK_1: backup set complete, elapsed time: 00:00:01
Finished backup at 31-OCT-12

RMAN> exit

Recovery Manager complete.
[oracle@uhesse1 ~]$ sqlplus / as sysdba

SQL*Plus: Release 11.2.0.3.0 Production on Wed Oct 31 15:13:41 2012

Copyright (c) 1982, 2011, Oracle.  All rights reserved.

Connected to:
Oracle Database 11g Enterprise Edition Release 11.2.0.3.0 - 64bit Production
With the Partitioning, OLAP and Data Mining options

SQL> exec dbms_workload_repository.create_snapshot

PL/SQL procedure successfully completed.

SQL> select snap_id,to_char(begin_interval_time,'yyyy-mm-dd:hh24:mi:ss')
from dba_hist_snapshot order by 1;

   SNAP_ID TO_CHAR(BEGIN_INTER
---------- -------------------
     2 2012-01-18:15:09:15
     3 2012-01-18:15:20:30
     4 2012-01-19:12:51:40
     5 2012-03-19:12:03:03
     6 2012-10-31:14:59:25
     7 2012-10-31:15:06:13

6 rows selected.
Some „Application“ load was followed by an RMAN backup. We can now differentiate those loads. The AWR report for the last two snapshots show this section:

We can tell from the low values of DB Time for the bk service in relation to the app1 service that the (Online-)Backup has had almost no impact on performance for end users here. Also, we have v$-views for services:
SQL> set lines 200
set pages 300
col service_name for a10
select service_name,event,time_waited
from v$service_event natural join v$event_name
where service_name in ('app1','bk')
and wait_class<>'Idle'
order by 1,3;

SERVICE_NA EVENT                                                            TIME_WAITED
---------- ---------------------------------------------------------------- -----------
app1       control file sequential read                                               0
app1       SQL*Net message to client                                                  0
app1       db file single write                                                       1
app1       db file scattered read                                                     1
app1       log file sync                                                              1
app1       control file parallel write                                                1
app1       direct path write                                                          2
app1       direct path sync                                                           3
app1       Data file init write                                                       3
app1       Disk file operations I/O                                                   4
app1       buffer busy waits                                                          5
app1       free buffer waits                                                         13
app1       log file switch (private strand flush incomplete)                         14
app1       db file sequential read                                                   26
app1       log file switch completion                                                28
app1       log buffer space                                                        1635
bk       Parameter File I/O                                                           0
bk       db file scattered read                                                       0
bk       SQL*Net message to client                                                    0
bk       SQL*Net break/reset to client                                                0
bk       db file single write                                                         0
bk       db file sequential read                                                      2
bk       control file parallel write                                                  7
bk       control file single write                                                    8
bk       Disk file operations I/O                                                    12
bk       control file sequential read                                                18
bk       events in waitclass Other                                                  217
bk       RMAN backup & recovery I/O                                                 757

28 rows selected.

SQL> select service_name,value
from v$service_stats
where service_name in ('app1','bk')
and stat_name='physical reads';

SERVICE_NA    VALUE
---------- ----------
app1            13422
bk                351
There are completely different Top Wait-Events for the two services. ‚physical reads‘ was just one example from the hundreds of available stats. In the very same manner, multiple applications running on the same DB could be differentiated. Furthermore, we can switch on tracing now for only certain services resp. applications:
SQL> exec dbms_monitor.serv_mod_act_trace_enable('app1')

PL/SQL procedure successfully completed.

SQL> connect adam/adam@uhesse1/app1
Connected.
SQL> select count(*) from sales;

  COUNT(*)
----------
   1000000

SQL> select distinct channel_id from sales;

CHANNEL_ID
----------
     1
     2
     4
     3
     0

SQL> connect / as sysdba
Connected.
SQL> exec dbms_monitor.serv_mod_act_trace_disable('app1')

PL/SQL procedure successfully completed.
This kind of service tracing produces potentially many trace files that we can consolidate (and identify) with trcsess like this:
[oracle@uhesse1 trace]$ trcsess output=app1.trc service=app1 *.trc
Afterwards, we can get a better readable output of the trace file with tkprof as usual, showing all the statements of the applications together with their execution plans.
Conclusion: You will always implement Application Services with RAC respectively Data Guard. For Single-Instance, you should use them also because
1) You may use RAC resp. Data Guard in the future and then you have everything in place already
2) You can do Performance Monitoring with a finer granule (on the Application layer) with them
3) You can trace with a finer granule as well
Pickleball spielen auf YouTube


