Beiträge getaggt mit AWR
Evidence for successful #Oracle Performance Tuning
This article shows an easy way to determine, whether your Oracle Database Performance Tuning task has been successful – or not. In the end, it boils down to „The objective for tuning an Oracle system could be stated as reducing the time that users spend in performing some action on the database, or simply reducing DB time.“ as the Online Documentation says. Best proof would be a confirmation from the end users that run time got reduced; second best is a proof of reduced DB time, which is discussed here.
A tuning task should always end with such a proof; your gut feeling or high confidence is not sufficient – or as I like to say: „Don’t believe it, test it!“ 🙂
The demo scenario: With an Oracle Enterprise Edition version 11.2.0.3, an application uses these commands to delete rows:
SQL> create table t as select * from dual where 1=2;

Table created.
SQL> begin
 for i in 1..100000 loop
 execute immediate 'delete from t where dummy='||to_char(i);
 end loop;
 end;
 /
I am pretty sure that this code is not optimal, because it uses Literals instead of Bind Variables where it is not appropriate. Before I implement an improved version of the code, I take a Baseline with Automatic Workload Repository (AWR) snapshots. On my demo system, snapshots are taken every ten minutes:
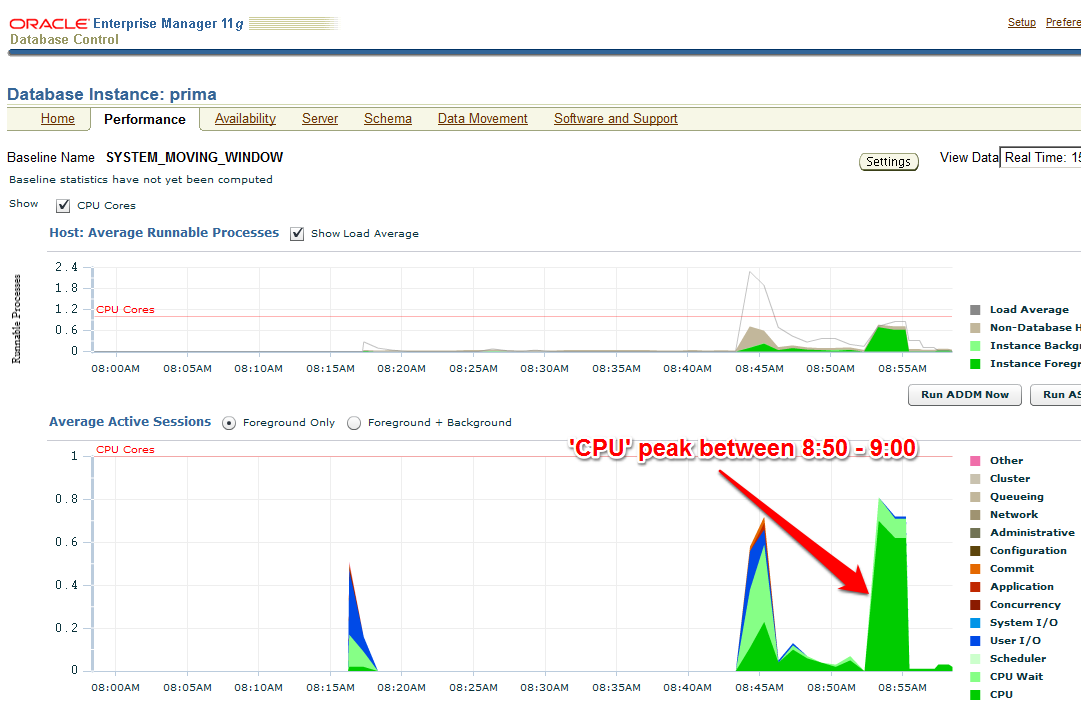
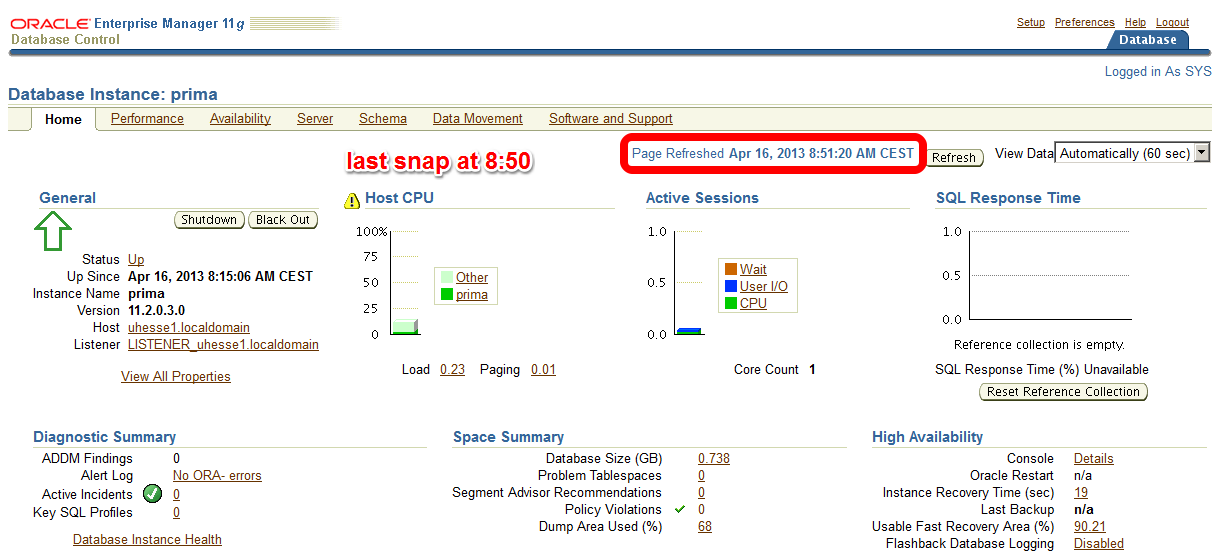 The code with Literals was just called – now about 10 minutes later on the Enterprise Manager (EM) Performance page:
 The AWR report that I take (with EM or with awrrpt.sql) as the baseline shows the following:
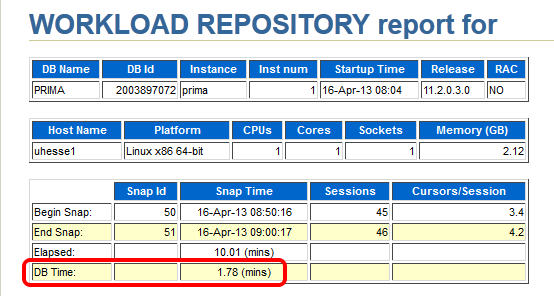 Notice especially the poor Library Cache hit ration, significant for not using Bind Variables – and the meaningless high Buffer Cache hit ration 🙂
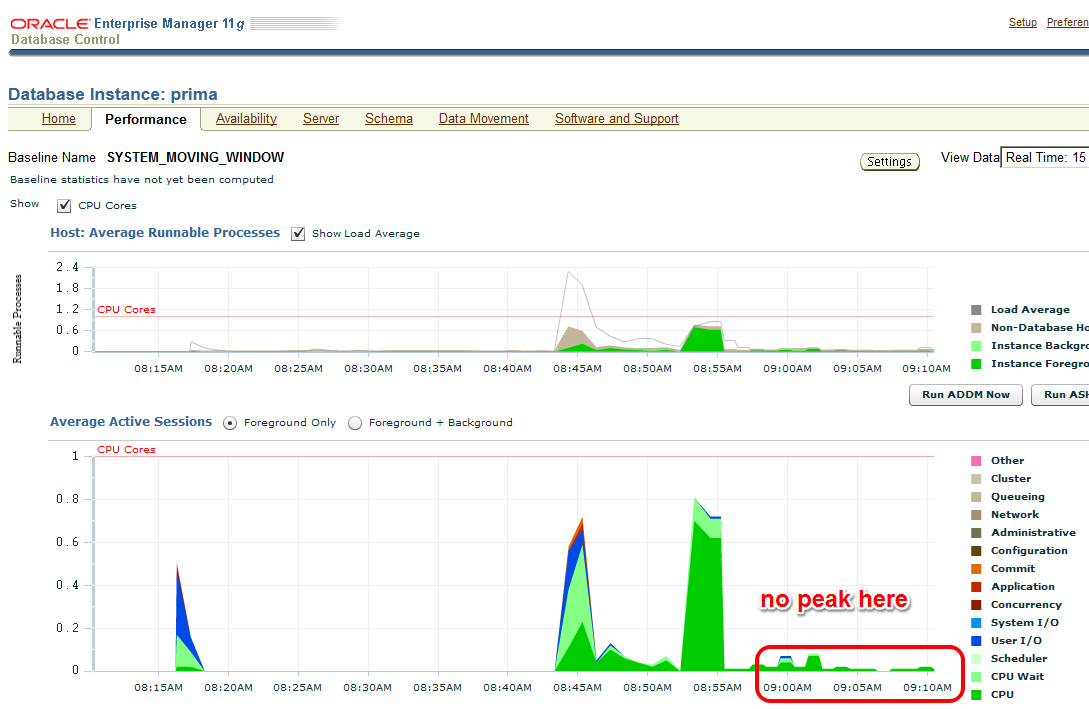
 Starting after 9:00 am, my improved code that uses Bind Variables runs:
SQL> begin
 for i in 1..100000 loop
 delete from t where dummy=to_char(i);
 end loop;
 end;
 /
The EM Performance page show no peak during the next 10 minutes which represent my comparison period after the tuning task:
 Let’s look at the AWR report of the second snapshot range after the tuning task:
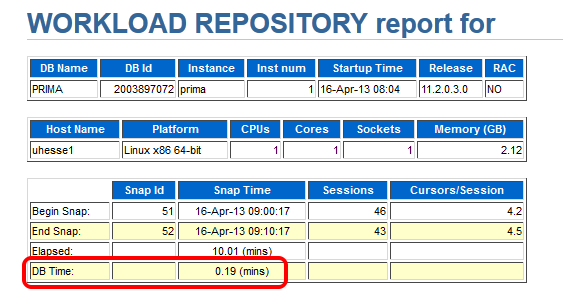 Same wall clock time, same application load, but reduced DB time – I was successful! Could stop here, but some more details:
 The important (especially for OLTP systems) Library Cache hit ratio is now very good. A very convenient way to compare the two snapshot ranges is the ‚AWR Compare Periods‘ feature in EM (or awrddrpt.sql) , which shows us instructively:
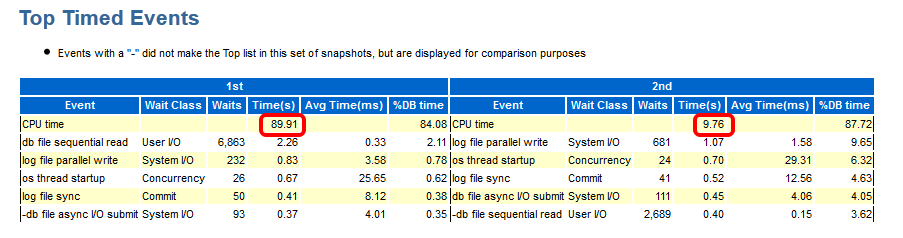
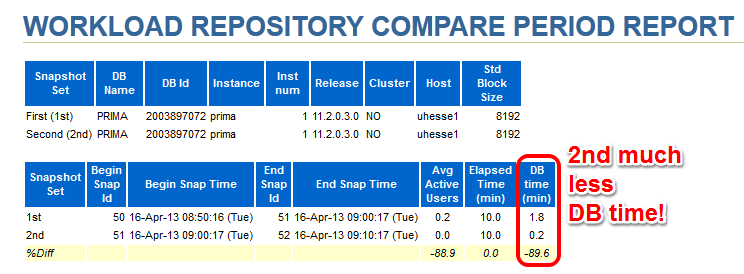 Although in both periods, CPU was the top event (also in % DB time), it took much less time in total for the 2nd period:
 The Time Model Statistics confirm a strongly reduced Parse Time for the 2nd period:
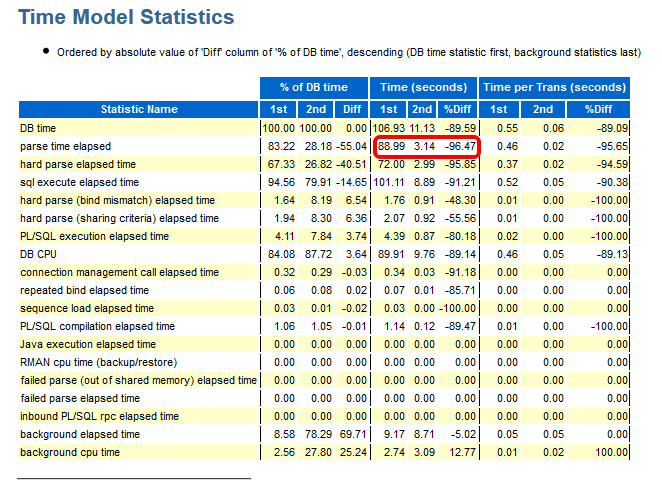 Especially, we see a striking improvement for the run time of the code with Bind Variables: From about 82 seconds down to about 3 seconds!
 This kind of proof (less DB time) can be used also in cases where the reduction of run time for a single statement is not so obvious as in my example. If 1000 users had done each 100 deletes, they would have seen not much difference in run time each – but the parse time summarizes and impacts overall performance similar as seen here. If you would like to see the three original AWR reports were I took the screen shots above from, they are here as PDFs
Conclusion: You will – and should – be able to prove the effectiveness of your Oracle Database Tuning task with a reduction of DB time from an AWR report comparison. After all, you don’t want to waste your efforts, do you? 🙂
Addendum: This posting was published in the Oracle University EMEA Newsletter May 2013
Retrieve SQL and Execution Plan from AWR Snapshots

A handy little script that I have used in the Oracle Database 11g Performance Tuning course this week. It queries the AWR Snapshots for SQL statements and sorts them by elapsed time:
SQL> col parsed format a6
col sql_text format a40
set lines 200
set pages 300

select
 sql_text,
 parsing_schema_name as parsed,
 elapsed_time_delta/1000/1000 as elapsed_sec,
 stat.snap_id,
 to_char(snap.end_interval_time,'dd.mm hh24:mi:ss') as snaptime,
 txt.sql_id
from
 dba_hist_sqlstat stat,
 dba_hist_sqltext txt,
 dba_hist_snapshot snap
where
 stat.sql_id=txt.sql_id and
 stat.snap_id=snap.snap_id and
 snap.begin_interval_time>=sysdate-1 and
 lower(sql_text) like '%&t%' and
 parsing_schema_name not in ('SYS','SYSMAN','MDSYS','WKSYS')
order by elapsed_time_delta asc;
sysdate-1 returns SQL up to yesterday and can be modified to retrieve SQL as long as there are AWR snapshots of course. &t is a substring of the SQL, we may be interested in. With the sql_id, we can also retrieve the execution plan from the snapshots:
SQL> select plan_table_output from table (dbms_xplan.display_awr('&sqlid'));
The amount of SQL that gets collected into a snapshot can be modified with
SQL> begin
dbms_workload_repository.modify_snapshot_settings (
 topnsql=>'MAXIMUM');
end;
/
MAXIMUM (uppercase!) takes all SQL from the Library Cache into the snapshot – alternative, we can specify a number of Top SQL to collect. The example is from an 11g Database, but it should work the same with 10g already.
Pickleball spielen auf YouTube


