Full Database Caching in #Oracle 12c
If your Oracle Database fits into the buffer cache, we will put all segments into it now upon access – no more direct reads:
SQL> connect / as sysdba
Connected.
SQL> select banner from v$version;

BANNER
--------------------------------------------------------------------------------
Oracle Database 12c Enterprise Edition Release 12.1.0.2.0 - 64bit Production
PL/SQL Release 12.1.0.2.0 - Production
CORE	12.1.0.2.0	Production
TNS for Linux: Version 12.1.0.2.0 - Production
NLSRTL Version 12.1.0.2.0 - Production

SQL> select sum(bytes)/1024/1024 as mb from v$datafile;

	MB
----------
      1424

SQL> select current_size from v$buffer_pool;

CURRENT_SIZE
------------
	1872
The requirements are met here, I don’t need to force anything:
SQL> select force_full_db_caching from v$database;

FORCE_FUL
---------
NO

SQL> select bytes/1024/1024 as mb from dba_segments
     where owner='ADAM' and segment_name='SALES';

	MB
----------
       600

SQL> select count(*) from adam.sales;

  COUNT(*)
----------
  10000000

SQL> show parameter parallel_degree_policy

NAME				     TYPE
------------------------------------ ---------------------------------
VALUE
------------------------------
parallel_degree_policy		     string
MANUAL
The table got accessed once and is now loaded into the buffer cache. PARALLEL_DEGREE_POLICY is on the default MANUAL, remember that.
SQL> connect adam/adam
Connected.
SQL> select name,value from v$mystat natural join v$statname
     where name in ('physical reads','physical reads direct','session logical reads');

NAME							VALUE
-------------------------------------------------- ----------
session logical reads					   42
physical reads						    0
physical reads direct					    0

SQL> select count(*) from sales;

  COUNT(*)
----------
  10000000

SQL> select name,value from v$mystat natural join v$statname
     where name in ('physical reads','physical reads direct','session logical reads');

NAME							VALUE
-------------------------------------------------- ----------
session logical reads					75620
physical reads						    0
physical reads direct					    0
Only logical reads, because the table is in the buffer cache. Also for parallel queries:
SQL> select /*+ parallel (sales,4) */ max(amount_sold) from sales;

MAX(AMOUNT_SOLD)
----------------
	    5000

SQL> select * from v$pq_sesstat;

STATISTIC					   LAST_QUERY SESSION_TOTAL	CON_ID
-------------------------------------------------- ---------- ------------- ----------
Queries Parallelized					    1		  1	     0
DML Parallelized					    0		  0	     0
DDL Parallelized					    0		  0	     0
DFO Trees						    1		  1	     0
Server Threads						    4		  0	     0
Allocation Height					    4		  0	     0
Allocation Width					    1		  0	     0
Local Msgs Sent 					  156		156	     0
Distr Msgs Sent 					    0		  0	     0
Local Msgs Recv'd					  156		156	     0
Distr Msgs Recv'd					    0		  0	     0
DOP							    4		  0	     0
Slave Sets						    1		  0	     0

13 rows selected.

SQL> select name,value from v$mystat natural join v$statname
     where name in ('physical reads','physical reads direct','session logical reads');

NAME							VALUE
-------------------------------------------------- ----------
session logical reads				       152410
physical reads						    0
physical reads direct					    0

SQL> select name,value from v$sysstat where name='physical reads direct';

NAME							VALUE
-------------------------------------------------- ----------
physical reads direct					   21

SQL> select /*+ parallel (sales,4) */ max(amount_sold) from sales;

MAX(AMOUNT_SOLD)
----------------
	    5000

SQL> select name,value from v$sysstat where name='physical reads direct';

NAME							VALUE
-------------------------------------------------- ----------
physical reads direct					   21
Looks like I did In-Memory Parallel Query although PARALLEL_DEGREE_POLICY is on MANUAL, doesn’t it? Just for comparison, I did the same with an 11g version:
SQL> select banner from v$version;

BANNER
-------------------------------------------------------------------------------------
Oracle Database 11g Enterprise Edition Release 11.2.0.3.0 - 64bit Production
PL/SQL Release 11.2.0.3.0 - Production
CORE	11.2.0.3.0	Production
TNS for Linux: Version 11.2.0.3.0 - Production
NLSRTL Version 11.2.0.3.0 - Production

SQL> select sum(bytes)/1024/1024 as mb from v$datafile;

	MB
----------
      1090

SQL> select current_size from v$buffer_pool;

CURRENT_SIZE
------------
	1200

SQL> select bytes/1024/1024 as mb from dba_segments where owner='ADAM' and segment_name='SALES';

	MB
----------
       528


SQL> select count(*) from adam.sales;

  COUNT(*)
----------
  10000000

SQL> show parameter parallel_degree_policy

NAME				     TYPE			       VALUE
------------------------------------ --------------------------------- ---------
parallel_degree_policy		     string			       MANUAL

SQL> connect adam/adam
Connected.
SQL> select name,value from v$mystat natural join v$statname
     where name in ('physical reads','physical reads direct','session logical reads');

NAME									    VALUE
---------------------------------------------------------------------- ----------
session logical reads							       26
physical reads									0
physical reads direct								0

SQL> select count(*) from sales;

  COUNT(*)
----------
  10000000

SQL> select name,value from v$mystat natural join v$statname
     where name in ('physical reads','physical reads direct','session logical reads');

NAME									    VALUE
---------------------------------------------------------------------- ----------
session logical reads							    67465
physical reads								    67433
physical reads direct							    67433

SQL> select /*+ parallel (sales,4) */ max(amount_sold) from sales;

MAX(AMOUNT_SOLD)
----------------
	    5000

SQL> select * from v$pq_sesstat;

STATISTIC				   LAST_QUERY SESSION_TOTAL
------------------------------------------ ---------- -------------
Queries Parallelized				    1		  1
DML Parallelized				    0		  0
DDL Parallelized				    0		  0
DFO Trees					    1		  1
Server Threads					    4		  0
Allocation Height				    4		  0
Allocation Width				    1		  0
Local Msgs Sent 				  116		116
Distr Msgs Sent 				    0		  0
Local Msgs Recv'd				  116		116
Distr Msgs Recv'd				    0		  0

11 rows selected.

SQL> select name,value from v$mystat natural join v$statname
     where name in ('physical reads','physical reads direct','session logical reads');

NAME									    VALUE
---------------------------------------------------------------------- ----------
session logical reads							   135115
physical reads								   134866
physical reads direct							   134866
As you can see, I got direct reads in 11g for both the serial and the parallel query.
Do not confuse this feature with the In-Memory Option, it is much less sophisticated than that. But it doesn’t come with an extra charge at least 🙂
DOAG annual conference 2015 – great as always!
Another annual DOAG conference has passed, and I can only say the very best about it: Perfectly organized, large and modern location, impressive list of well known speakers and over 2100 attendees – wow!

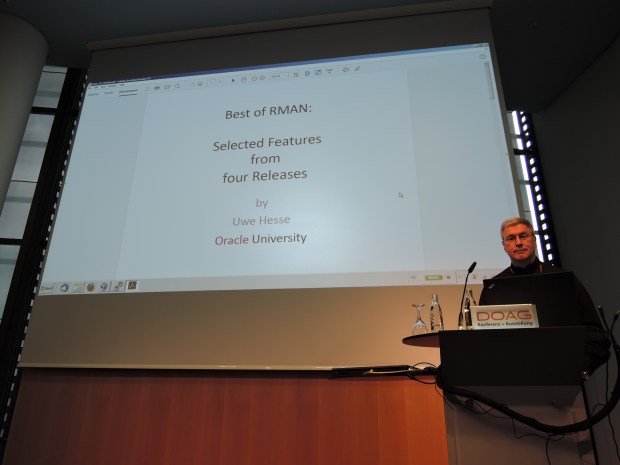
My presentation Best of RMAN was scheduled at the first slot on the first day, so I was a bit concerned whether many people would attend that early. It turned out that the room got so full that I was asked by the organizers to deliver the same talk again next day – which I happily did, again with a packed room 🙂
Apart from speaking myself, I enjoyed very much to see friends and colleagues again, as well as people I knew from social media before but never met in person yet. Thank you all for your good company guys – I may appear a bit quiet and distanced sometimes, but I really appreciate you and our little conversations. Personal highlight: The lady who approached me at the stairs, shaking hands and telling me that she knew me from an Oracle University class that she liked so much 🙂
There were many interesting presentations, just to mention some of those I attended myself:
Frits Hoogland with Oracle Exadata and database memory

In his very detailed talk, he emphasized the importance of using Huge Pages on Exadata and that MEMORY_TARGET aka Automatic Memory Management is not an option here.
Jonathan Lewis presented Five Hints for Optimising SQL

I’m always amazed how much this man knows and how good he is able to explain it to us mere mortals 🙂
Lothar Flatz was presenting Anatomie eines SQL Befehls (how to do Oracle Performance Tuning with a scientific approach)

During his very entertaining talk, he quoted no less than seven Oakies (including himself), so that was quite good advertising for the OakTable Network 🙂
Frank Schneede delivered Eine Datenbank kommt selten allein (DB Cloning on Exadata using sparse diskgroups)

while Ulrike Schwinn presented Oracle DB Memory Techniken für mehr Performance (Overview about the meanwhile so many different ways to deal with memory in Oracle)

Couldn’t really catch her because she was running out of the picture all the time 🙂
Martin Berger also did an interesting talk: Wie misst Oracle die Verwendung von Database Features? (How to make sense of DBA_FEATURE_USAGE STATISTICS)

I liked his presentation style with many live demonstrations very much!
My dear colleague Joel Goodman talked about Automatic Parallel Execution

Joel is what I call a ‚Standup Instructor‘ – mention any database related topic and he will be able to deliver an excellent 30 minutes talk about it instantly 🙂
A big THANK YOU to the many people from DOAG who helped to make that event take place again in such an impressive way! Hope to be there again next year.
Auto optimizer stats after CTAS or direct loads in #Oracle 12c
Less famous 12c New Feature: If you do Create Table As Select (CTAS) or a direct load into an empty table, we will automatically collect optimizer statistics:
SQL> select banner from v$version;

BANNER
--------------------------------------------------------------------------------
Oracle Database 12c Enterprise Edition Release 12.1.0.2.0 - 64bit Production
PL/SQL Release 12.1.0.2.0 - Production
CORE    12.1.0.2.0      Production
TNS for Linux: Version 12.1.0.2.0 - Production
NLSRTL Version 12.1.0.2.0 - Production

SQL> create table nu as select * from sales where rownum<=100000;
Table created.

SQL> select num_rows,blocks from user_tables where table_name='NU';

  NUM_ROWS     BLOCKS
---------- ----------
    100000        695

SQL> truncate table nu;
Table truncated.

SQL> insert /*+ append */ into nu  select * from sales where rownum<=200000;
200000 rows created.

SQL> commit;
Commit complete.

SQL> select num_rows,blocks from user_tables where table_name='NU';

  NUM_ROWS     BLOCKS
---------- ----------
    200000       1379
If the table is not empty, the statistics are not updated:
SQL> insert /*+ append */ into nu  select * from sales where rownum<=100000;
100000 rows created.

SQL> commit;
Commit complete.

SQL> select num_rows,blocks from user_tables where table_name='NU';

  NUM_ROWS     BLOCKS
---------- ----------
    200000       1379
You see that the previous statistics have not been changed here.
If it is a conventional insert:
SQL> truncate table nu;
Table truncated.
SQL> insert into nu select * from sales where rownum<=100000;
100000 rows created.
SQL> commit;
Commit complete.
SQL> select num_rows,blocks from user_tables where table_name='NU';
NUM_ROWS BLOCKS
---------- ----------
    200000       1379
Again, the statistics have not been maintained automatically either. Can be done manually still, of course:
SQL> exec dbms_stats.gather_table_stats('ADAM','NU')

PL/SQL procedure successfully completed.

SQL> select num_rows,blocks from user_tables where table_name='NU';

  NUM_ROWS     BLOCKS
---------- ----------
    100000        748
So knowing that, you may be able to skip some manual statistics collections that you may have done in the past after CTAS or bulk loads 🙂
Pickleball spielen auf YouTube


